Reports
Achievement and learning report
Track student progress across exams, scores over time, and the topics that need support.
Last updated
The Achievement and learning page helps you track student progress across exams, compare groups, and review suggested learning support. This article explains the student progress report and its four sections.
Open the page
From the side menu, click Reports.
Choose Achievement and learning.
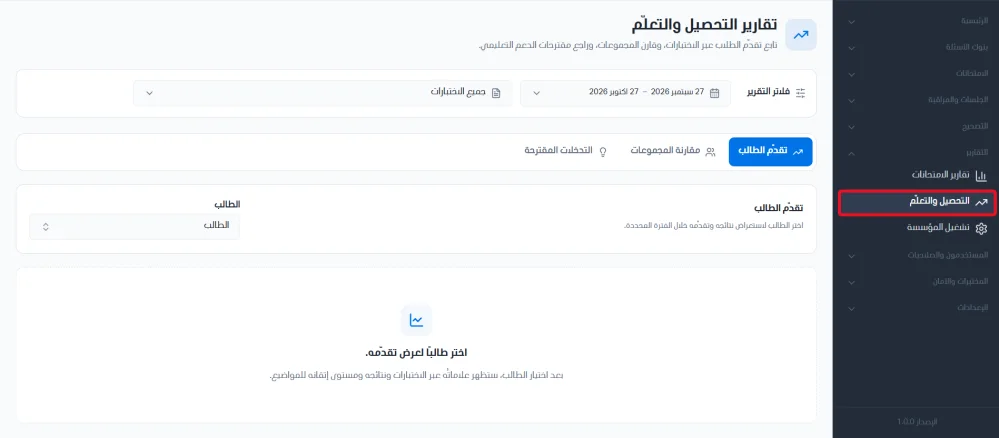
Report filters appear at the top of the page. You can filter the reports by time period or by exam. From this page you can select a student to view and review their reports.
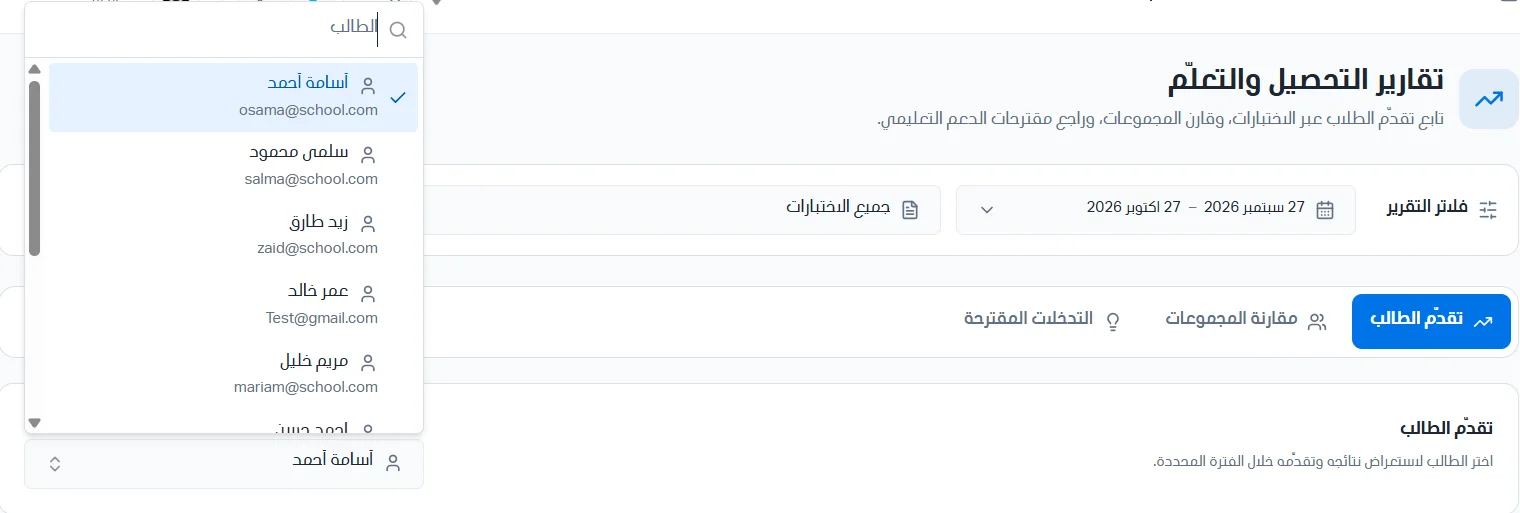
Section 1: Student performance summary
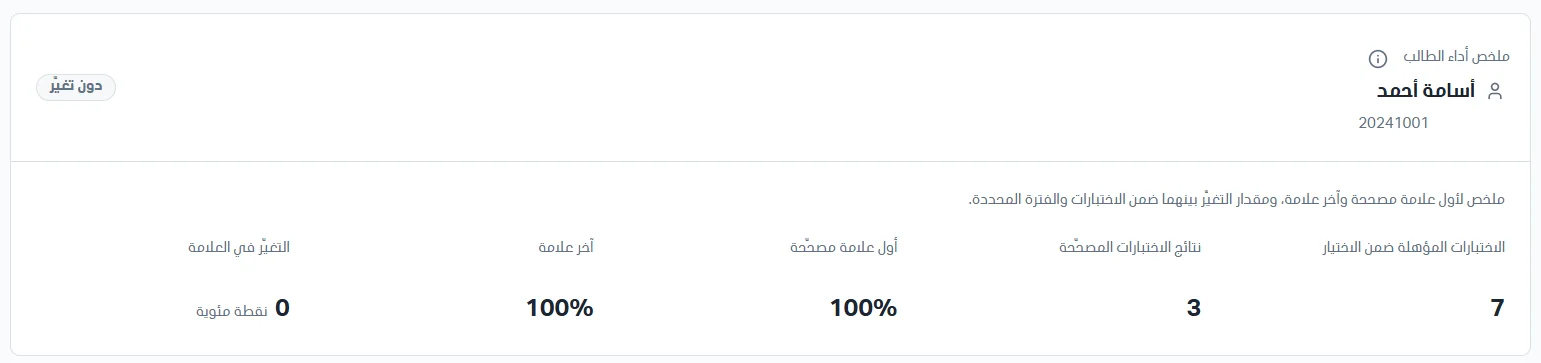
The summary shows the first graded score, the last graded score, and the change between them across the selected exams and period. It includes the following information:
The student's name and academic number.
The number of eligible exams in the selection (the exams covered by the filters).
Graded exam results (results that have a score and are included in the comparison; results awaiting grading are not included).
The first graded score.
The last graded score.
The change in score (the difference between the last graded score and the first score, in percentage points).
Section 2: Score over time
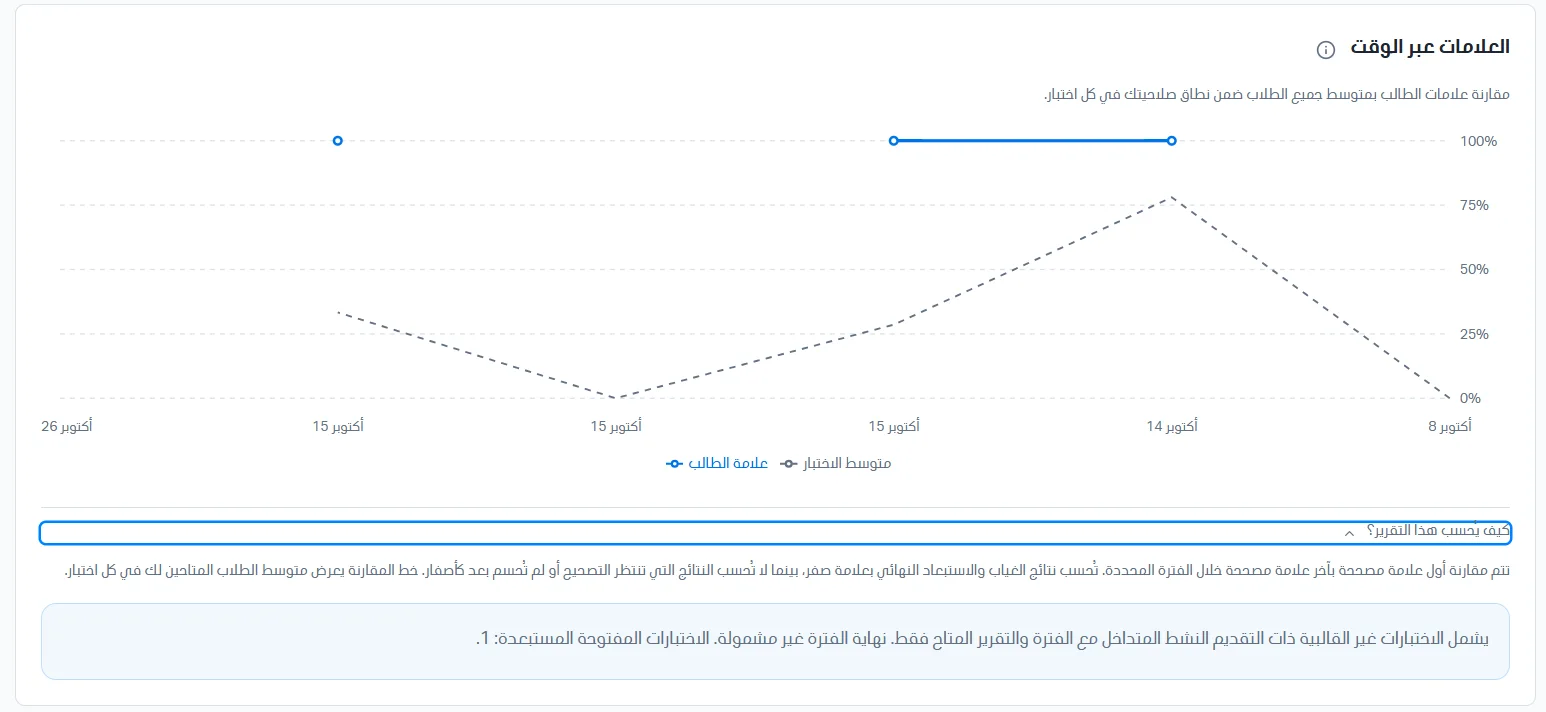
This section compares the student's scores with the average of all students within your permission scope in each exam.
Each point represents one exam. The horizontal axis is the date and the vertical axis is the score from 0% to 100%. Hover over a point to see its details.
Blue: the student's score.
Dashed gray: the average of the students available to you in each exam; the set of students may differ between exams.
Pending or undecided results leave a gap in the line and are not counted as zero. Absence and final exclusion are counted as zero.
Section 3: Results by exam
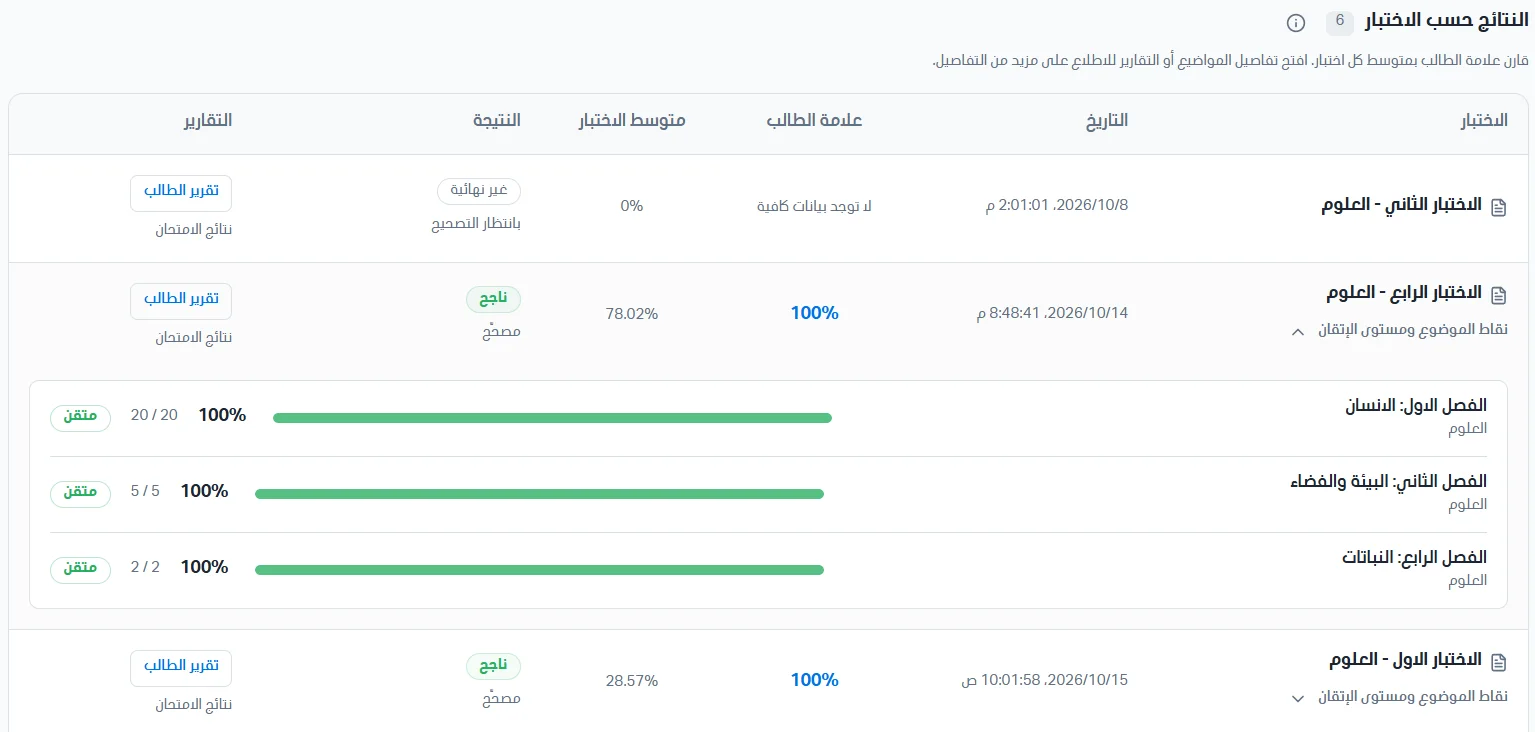
You can use the table to compare the student's score with each exam's average. The results appear in an organized table with the following data:
Exam name.
Exam date and time.
Student score.
Exam average.
Result.
Reports.
Click 'Topic points and mastery level' or 'Reports' to see more details. Each row represents one exam.
Topic points and mastery level: shows the exam's topic details.
Student report: opens the student's result.
Exam results: opens the exam's overall report.
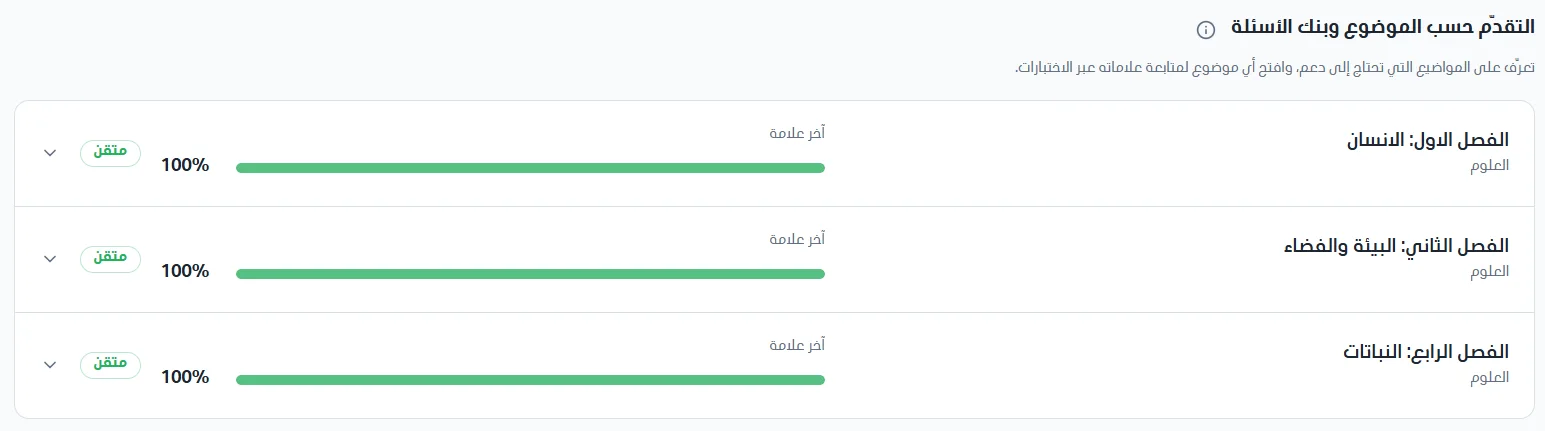
Section 4: Progress by topic and question bank
This section helps you identify the topics that need support and review topic scores across exams.
Each topic appears separately with its question bank, even if the same name appears in more than one bank.
The bar shows the topic's latest score, not the average of its scores over the period.
The mastery badge shows the latest recorded level: weak, developing, or mastered. 'Needs support' appears when the topic needs follow-up.
No data does not mean the score is zero.