Reports
Institution operations report
Monitor system usage, exam statuses, student attendance, and app connectivity over a chosen period.
Last updated
The Institution operations page lets you monitor the system and exam statuses, and review the login sessions available within your permission scope.
Open the page
From the side menu, click Reports.
Choose Institution operations.
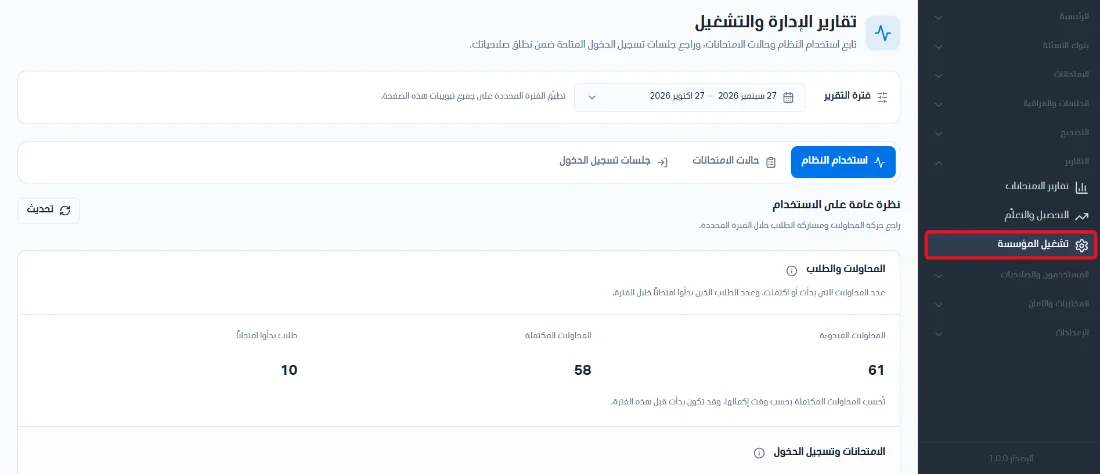
The report period filter appears at the top of the page. You can filter the reports by a specific time range. This filter applies to all tabs on the page.
System usage
This page gives you an overview of usage, so you can review attempt activity and student participation over a chosen period. Click Refresh to make sure you have the latest data in the system.
Section 1: Attempts and students. This shows the number of attempts that were started or completed and the number of students who started an exam during the selected period. The card shows the following data:
Number of attempts started.
Number of attempts completed.
Number of students who started an exam.
Usage includes attempts started in all statuses, including canceled ones.
Completed attempts are counted by the time they were completed.
A count hidden because of data scope does not mean zero.
An attempt may start before the period and be completed within it, or start within the period and be completed after it; therefore the start event and the completion event are each counted by their own time.
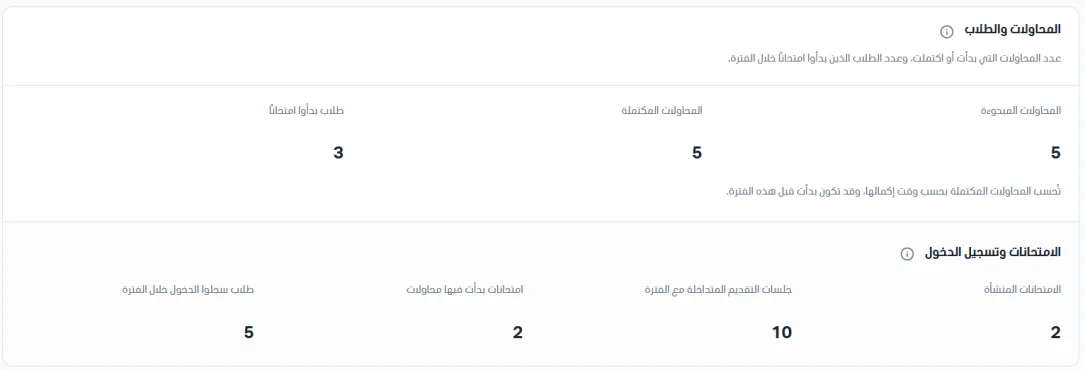
Section 2: Exams and logins. The card shows the following data:
Number of exams created.
Number of delivery sessions overlapping the period.
Number of exams in which attempts started.
Number of students who logged in during this period.
Delivery sessions are the exam availability windows that overlap the selected period. A single exam may have more than one delivery session.
The value for students who logged in may be hidden depending on your data scope. In that case an unavailable message appears, and the count should not be assumed to be zero.
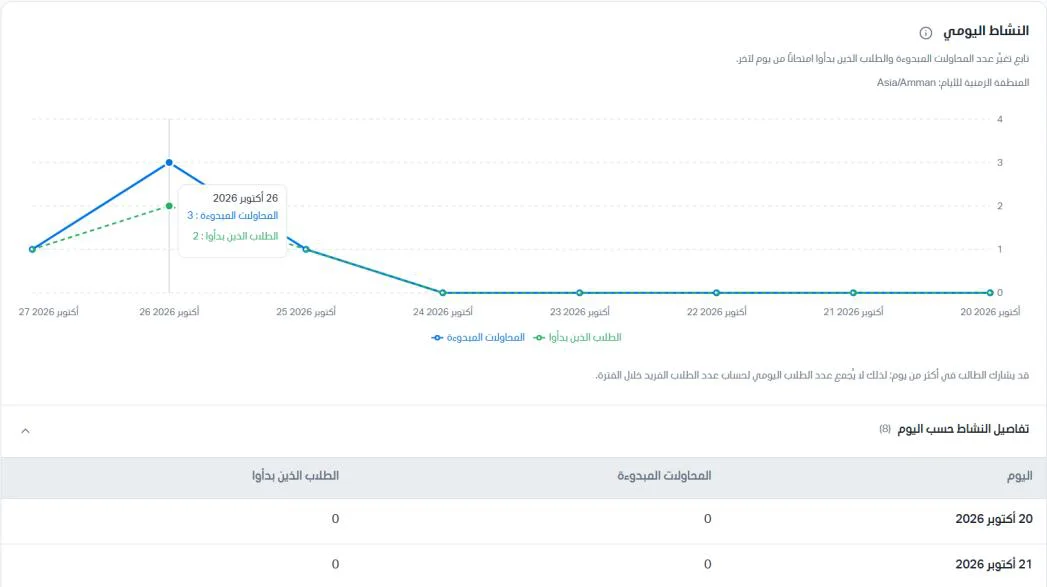
Section 3: Daily activity. This section lets you follow how the number of attempts started and the number of students who started an exam change from day to day.
Blue represents attempts started, and dashed green represents students who started an exam.
The horizontal axis is the date and the vertical axis is the count.
Days follow the time zone stated in the report.
A student is counted once on each day they took part, and may appear on several days. The total of unique students over the period is shown in the report summary.
The activity-by-day details table shows the number of attempts started and the number of students who started.
Exam statuses
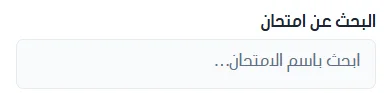
This page helps you track the current standing of each exam: whether it is upcoming, active, or finished, and how many students were expected, attended, and were absent. The page shows the exams whose delivery windows overlap the period you set; if an exam's session falls entirely or partly within the period, the exam appears in the list. You can search for an exam using the search bar, and click Refresh to reload the current numbers.
The cards at the top show the number of exams in each status:
Upcoming exams: exams none of whose sessions has started yet.
Active exams: exams with at least one session running now.
Finished exams: exams all of whose sessions have ended.

Next come the totals for all matching exams:
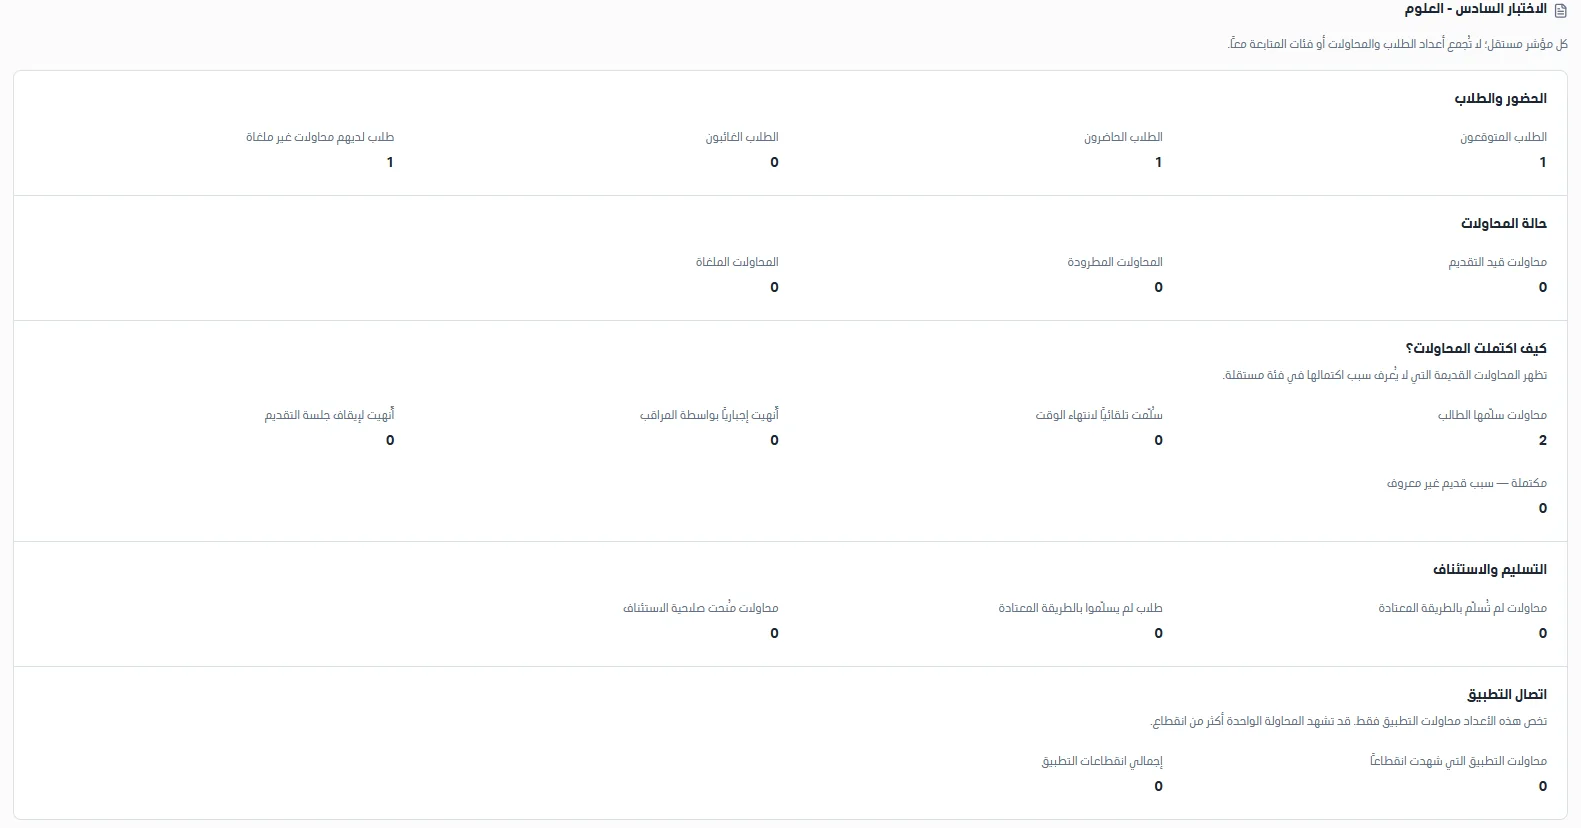
Attendance and students: number of expected students, number of students who attended, number of absent students, and number of students with non-canceled attempts.
Attempt status: number of attempts in progress, number of expelled attempts, and number of canceled attempts.

How were attempts completed? Number of attempts submitted by the student, automatically submitted when time ran out, force-ended by the proctor, ended to stop the delivery session, and completed for an unknown legacy reason. Older attempts whose completion reason is not known appear in a separate category.

Submission and resumption: number of attempts not submitted in the usual way, number of students who did not submit in the usual way, and number of attempts granted permission to resume.

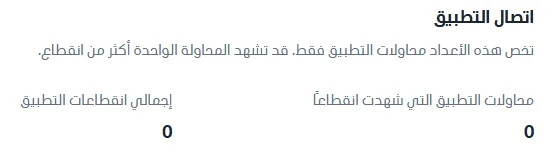
App connectivity: number of app attempts that experienced a disconnection and the total number of app disconnections. These counts apply to app attempts only, and a single attempt may experience more than one disconnection.
Exams table
The exams table shows the following data:
Exam name.
Exam status (for example: active, upcoming, completed).
Number of expected students.
Number of students who attended.
Number of absent students.
Number of attempts in progress.
Actions: you can open the exam log or view the details.
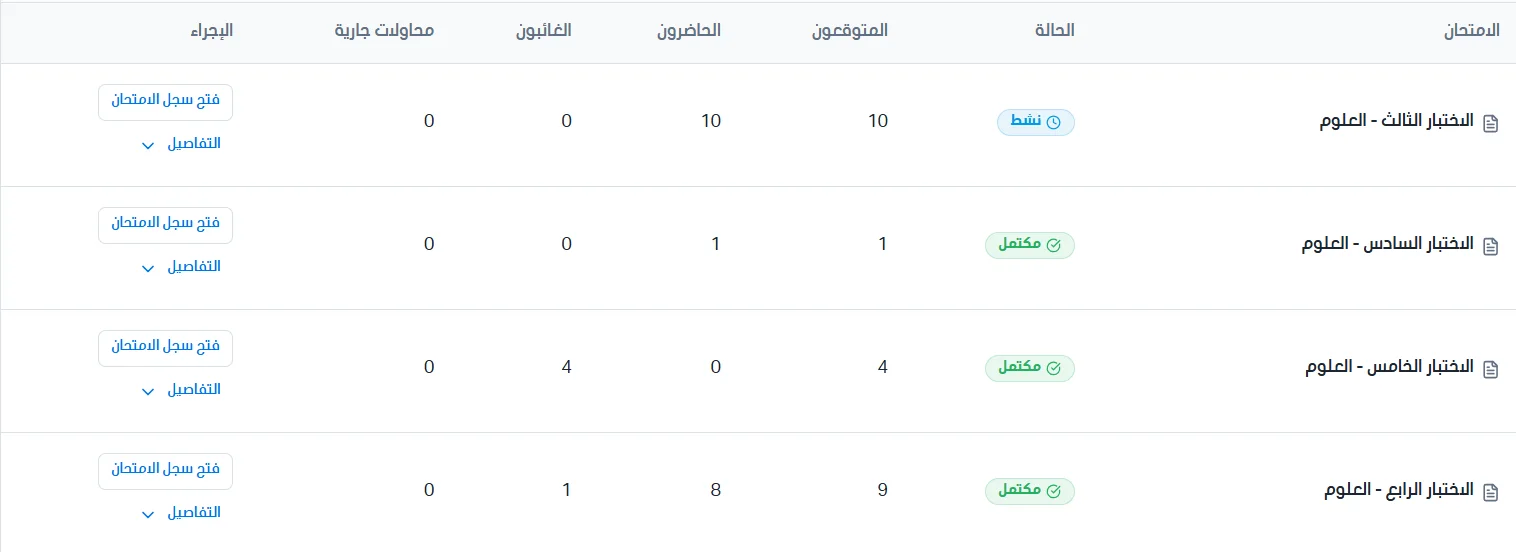
Click Open exam log to go to the score change log page in the scores and devices log, and click Details to see the indicators for that exam.