Reports
Results summary and distribution
Understand the exam results summary and its indicators, and how to read the score and grade distributions.
Last updated
The Results page shows reports and analysis of student results in the exam. It starts with an overview made up of two sections: the results summary and the results distribution.
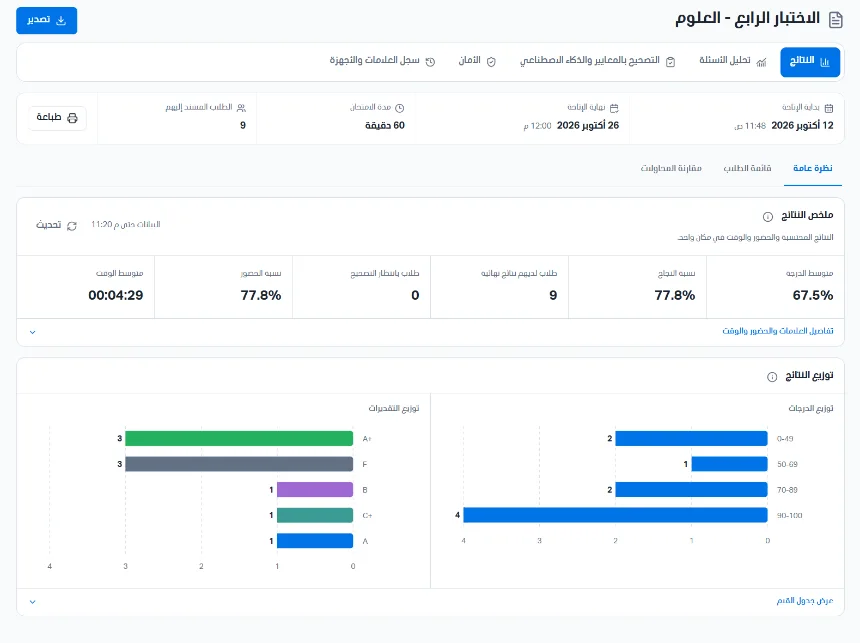
Information at the top of the page
Availability start: the date and time the exam starts.
Availability end: the date and time the exam ends.
Exam duration: the exam time in minutes.
Assigned students: the number of students the exam is assigned to.
You can click Print to print the results report.
Section 1: Results summary
This section shows the exam's key indicators in one place: calculated results, attendance, and time. Next to the section title you will see the time the data was last updated and a refresh button to load the latest data, and an (i) icon shows a short explanation of the indicators.
Average score: the average of the students' final results. One final result is calculated per student, and students awaiting grading are not included in score statistics.
Pass rate: the share of passing students out of the students who have final results (example: 7 of 9 = 77.8%).
Students with final results: the number of students whose final result has been approved; these are the students counted in the average and the pass rate.
Students awaiting grading: the number of students who still have answers that need grading. Their results are not counted in score statistics until their grading is complete.
Attendance rate: the share of attending students out of the expected students (example: 7 of 9 = 77.8%).
Average time: the average actual time students spent on completed attempts, in hours:minutes:seconds format.

Click Marks, attendance, and time details to show the following groups:
Marks: passing students and failing students (the count of each), highest score and lowest score (the highest and lowest final result), fail rate, and students with a zero score (the number of students whose result is zero).
Attendance: expected students (the number of students required to attend), attending students (those who sat the exam), and absent students (those who did not).
Time: shortest time and longest time, which are the shortest and longest actual time a student spent on a completed attempt.

Important notes when reading the numbers
Zero is an actual result. The phrase "Not available yet" means the value is not currently available and is not treated as zero.
Attendance and results are independent indicators: attendance figures concern those who sat the exam, while result indicators concern final results. A student may be present while their result is still awaiting grading.
Times are actual times: they refer to completed attempts and are not the exam's availability period.
Average, shortest, and longest time are based on the counted completed attempts, including attempts that are awaiting grading.
Section 2: Results distribution
This section shows the number of students in each score range and in each grade, so the teacher can see the class's performance level at a glance. Results still awaiting grading are not included in the two charts, and a note saying so appears under the section title. An (i) icon next to the title shows a short explanation.
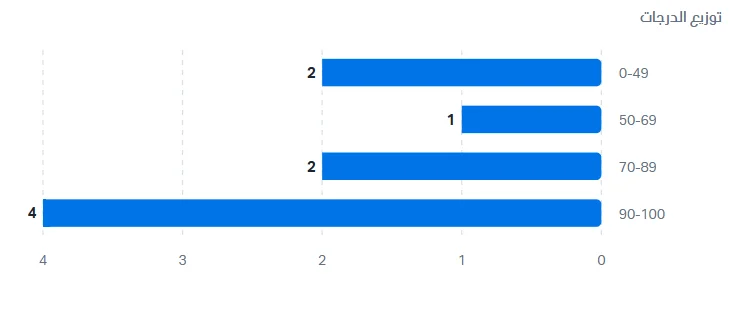
Score distribution: a horizontal bar chart in which each bar is a score range (100-90, 89-70, 69-50, 49-0). The bar length and the number beside it show how many students' final results fall in that range. Example: 4 students in 100-90, 2 students in 89-70, 1 student in 69-50, and 2 students in 49-0.
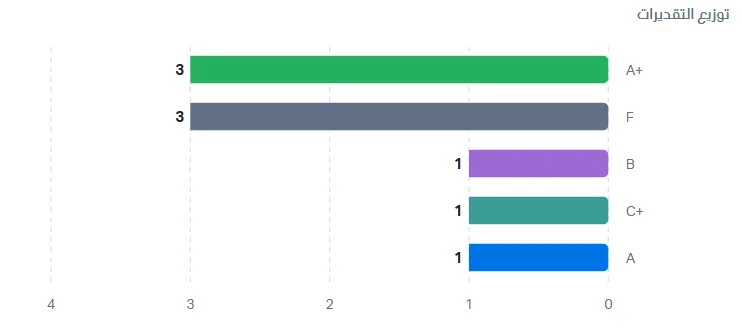
Grade distribution: a horizontal bar chart in which each bar is a grade in a different color. Only grades earned by at least one student appear (A+, A, B, C+, and F in the example), and the number beside the bar is the number of students who got that grade. Bars are ordered by number of students, not by grade level. Example: A+ (3 students), F (3 students), and A, B, and C+ (one student each).
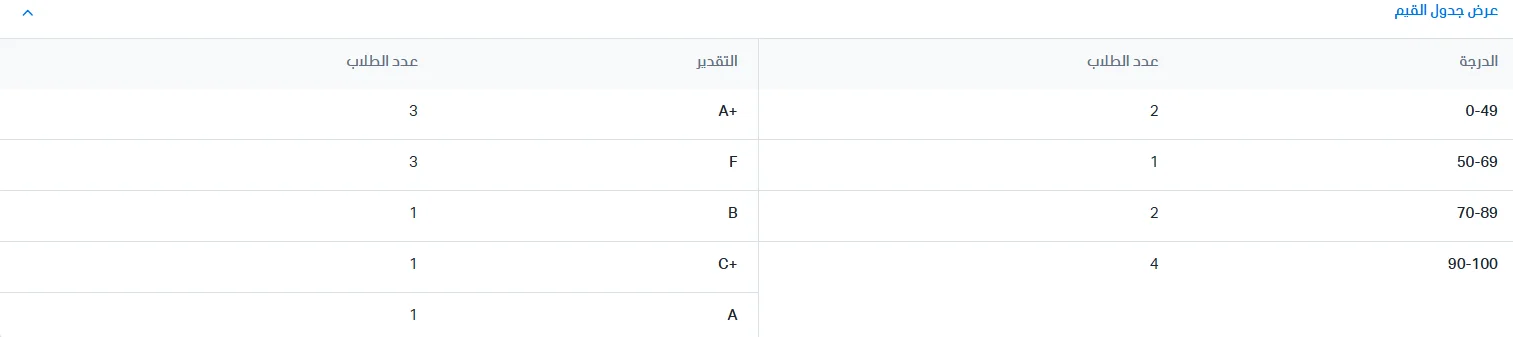
Values table
Click Show values table to see the same numbers in two tables: a scores table (score/range and number of students) and a grades table (grade and number of students). This is useful for reading exact numbers instead of estimating them from the bar length. Click the arrow to hide the table.
How to use this section
Judging the exam's level: students concentrated in the upper ranges indicate an easy exam, and students concentrated in the lower ranges indicate a hard exam.
Spotting disparity: bars at both ends (lowest and highest ranges) with few in the middle indicate a large gap between students.
Comparing the two charts: the totals in both charts are equal (9 students in the example) and equal the number of students with final results in the results summary.
