Reports
Question analysis and student answers
Understand actual question difficulty and the question analysis table, and analyze student answers and the most common choices.
Last updated
The question analysis page helps you see how difficult each question actually was and how students answered it. The following information appears at the top of the page: availability start and end, the exam duration in minutes, and the number of students the exam is assigned to.
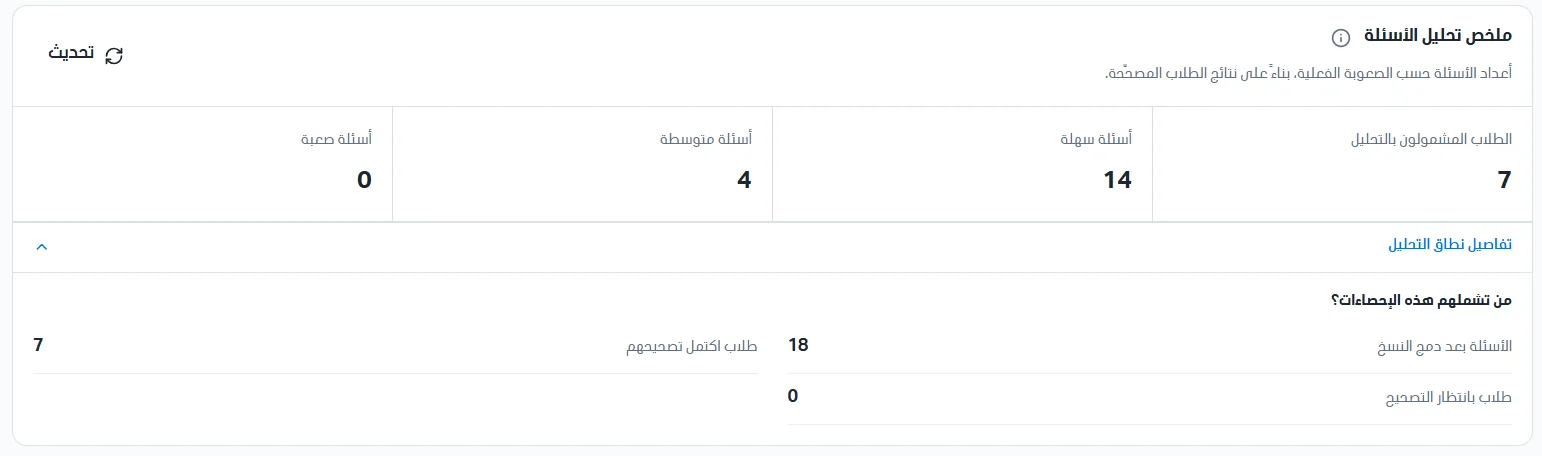
Question analysis summary
This section shows the number of questions at each actual difficulty level, based on the students' graded results. It differs from the difficulty level the teacher sets when creating the question. There is a refresh button to load the latest data and an (i) icon that shows a short explanation.
The actual difficulty of a question depends on the average ratio of the points students earned to the question's maximum points, noting that partial points are counted as they are, and left-blank answers (questions the student did not answer) count as zero. The difficulty levels are:
Easy: 80% or more.
Medium: from 40% to less than 80%.
Hard: less than 40%.
At the top of the question analysis summary, four cards appear:
Students included in the analysis: the number of students whose grading is complete and whose results enter the analysis.
Easy questions: the number of questions whose average points earned is 80% or more.
Medium questions: the number of questions whose average is between 40% and less than 80%.
Hard questions: the number of questions whose average is below 40%.
Example: 7 students included, 14 easy questions, 4 medium questions, and no hard questions.
Click Analysis scope details to see who these statistics cover. It shows: questions after merging versions (the number of analyzed questions after merging versions, which is the total across the three levels: 14 + 4 + 0 = 18), students whose grading is complete (the number of students included in the analysis), and students awaiting grading (the number of students not included because their grading is not complete).
One attempt per student: the approved, fully graded attempt is counted once per student, and retakes are not counted as additional students.
Pending results (awaiting grading) are excluded.
The number of students who received each question varies: not all students may get the same questions, so student counts differ per question.
Difficulty does not determine question quality: an easy or hard question is not necessarily bad, so use the question analysis and the charts to assess quality.
Categories with no available data (such as a question nobody answered) are not counted as zero; they are left out of the count.
Question analysis table
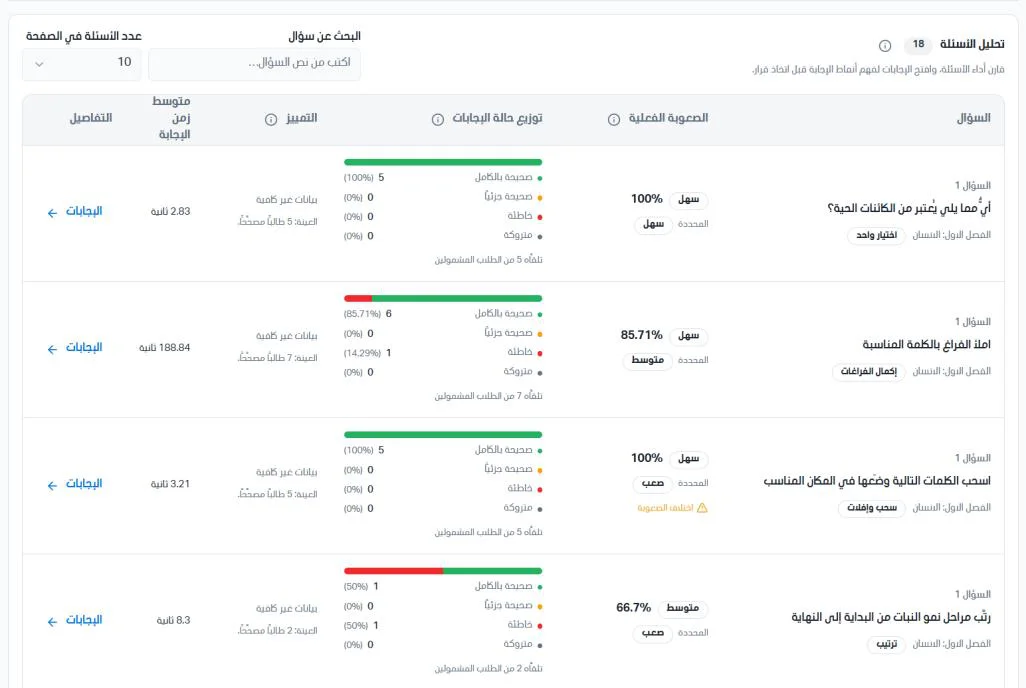
This table compares the performance of each question in the exam and lets you see the answers to understand students' answer patterns before deciding what to do with the question (keep it, edit it, or replace it). The number of questions appears next to the title, and an (i) icon shows a short explanation. You can search for a question by entering part of its text, and choose how many questions are shown per page. Questions appear in a table with the following data:
Question: the question text, the topic it belongs to (for example, Chapter 1: Humans), and the question type (single choice, fill in the blanks, drag and drop, and so on).
Actual difficulty: the actual difficulty compared with the set difficulty, based on the average ratio of points earned to maximum points, with partial points and left-blank answers counted as zero. It is not the share of fully correct answers.
Answer status distribution: each row represents one question with all its modified versions that graded students received. The numbers refer to students, not attempts.
Discrimination: compares the points ratios between the top-performing and lowest-performing groups of students. The coefficient is not a percentage.
Average answer time: the average time students spent answering the question, in seconds.
Details: click Answers to see and analyze students' answers to this question.
Answer analysis
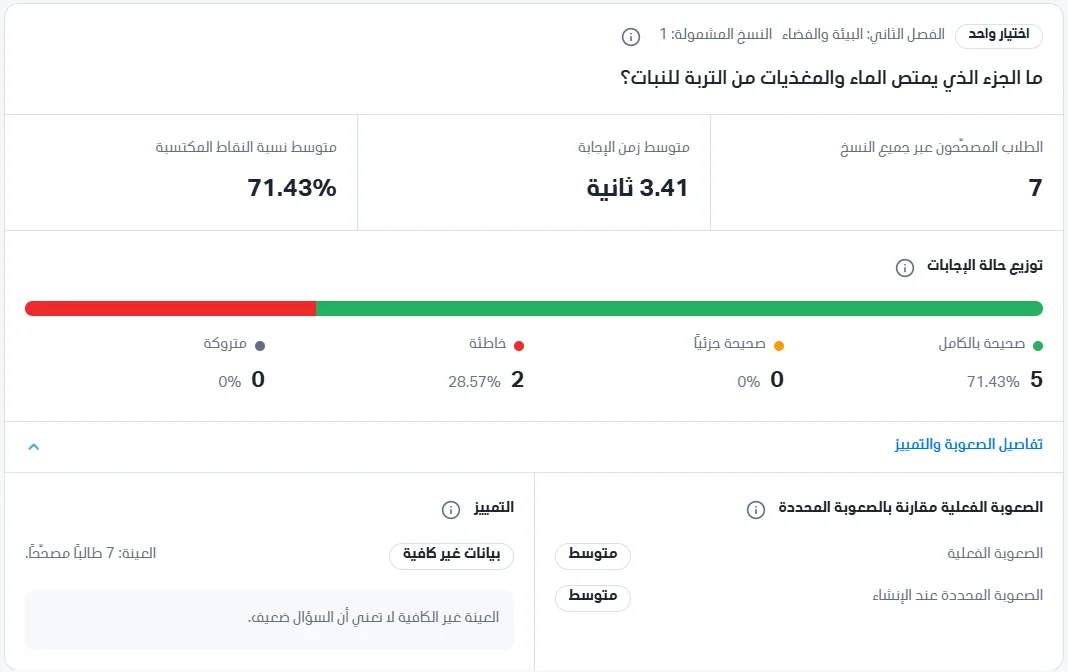
Click Answers to see the question's performance details and how students answered it. The analysis starts with the question card, which shows the question type, the topic, and the number of included versions that entered the analysis, plus:
Graded students across all versions: the number of students whose grading is complete and who received this question.
Average answer time: the average time students spent answering the question, in seconds.
Average points earned ratio: the average ratio of the points students earned out of the question's maximum points (for example, 71.43%), which is the basis of the actual difficulty.
Answer status distribution: a colored bar and numbers showing the share of each answer status: green is fully correct, orange is partially correct, red is wrong, and gray is left blank.
Click Difficulty and discrimination details to see the actual difficulty compared with the set difficulty. The actual difficulty is the question's classification based on student performance (easy, medium, or hard), and the difficulty set at creation is the level the teacher chose when creating the question. If the two levels differ, the question may need review.
Discrimination measures the question's ability to tell strong students from weak ones. When the sample is small, "Insufficient data" appears with the sample size (for example, sample: 7 graded students).
Most common answers
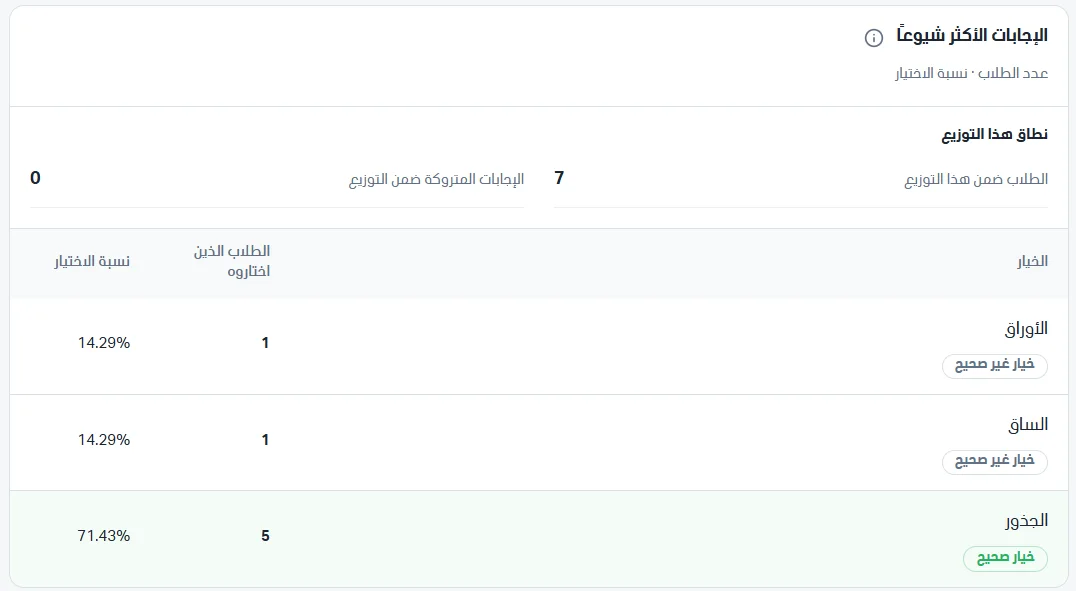
This table shows the options students chose in multiple-choice questions. The distribution scope includes: students in this distribution (the number of students included, for example 7) and left-blank answers within the distribution (the number who did not answer, for example 0). The table contains:
Option: the option text, with a correct option badge (green) or an incorrect option badge.
Students who chose it: the number of students who chose this option.
Selection rate: their share of the students within the distribution.
How to use this analysis:
A wrong option chosen by many: may indicate a common misunderstanding among students, or that the option is misleading or the wording is unclear.
The correct option chosen by few: review the question and the model answer, as the approved answer may be wrong or the question ambiguous.
An option nobody chose: it may be a weak distractor (easy to rule out) and can be replaced.
A high share of left-blank answers: may indicate the question is hard or the time was not enough.
