Reports
Question charts and quality review
Read the question difficulty and discrimination charts and topic analysis, and find the questions that deserve review.
Last updated
These pages show charts that compare question difficulty and discrimination across the whole exam, analyze questions by topic, and help you find the questions that deserve review after grading.
Charts
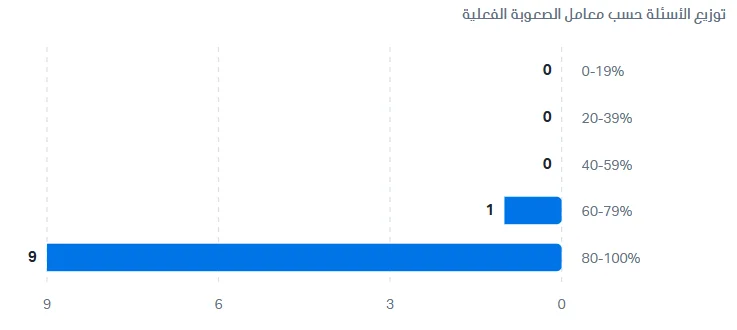
Question distribution by difficulty coefficient: a horizontal bar chart in which each bar is a range of actual difficulty (the average points earned ratio): 0-19%, 20-39%, 40-59%, 60-79%, and 80-100%. The bar length and the number beside it show the number of questions in that range.
Easy questions: the 80-100% range.
Medium questions: the 40-59% and 60-79% ranges.
Hard questions: less than 40% (the 0-19% and 20-39% ranges).
Example: 9 questions in the 80-100% range (easy), 1 question in 60-79% (medium), and none in the other ranges, which means the exam leans toward easy.
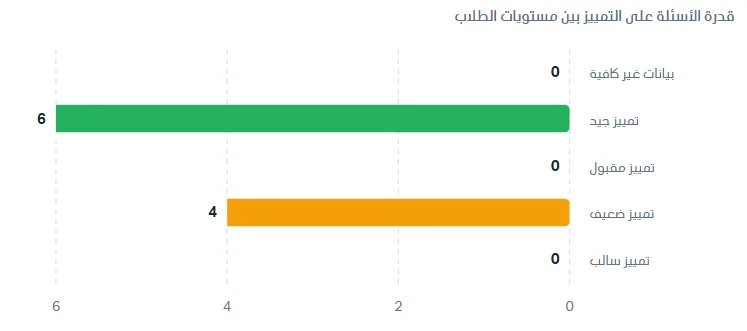
Question ability to discriminate between student levels: a horizontal bar chart in which each bar is a discrimination category, and the number beside it is the number of questions in the category. Discrimination measures how well a question separates strong students from weak ones. The categories are:
Good discrimination: strong students clearly answer the question better than weak ones, so the question does its job of separating them.
Acceptable discrimination: separates the levels to an acceptable degree.
Weak discrimination: the difference between strong and weak students' performance is small, so the question does not separate them enough.
Negative discrimination: weak students answered the question better than strong ones, which calls for reviewing the question (it may be ambiguous or its answer key may be wrong).
Insufficient data: there are not enough students to calculate discrimination.
Example: 6 questions with good discrimination, 4 questions with weak discrimination, and none in the other categories. Click Show values table to see the same numbers in two tables: the right one for the difficulty categories and the number of questions in each, and the left one for the discrimination categories and the number of questions in each. It is useful for reading exact values.

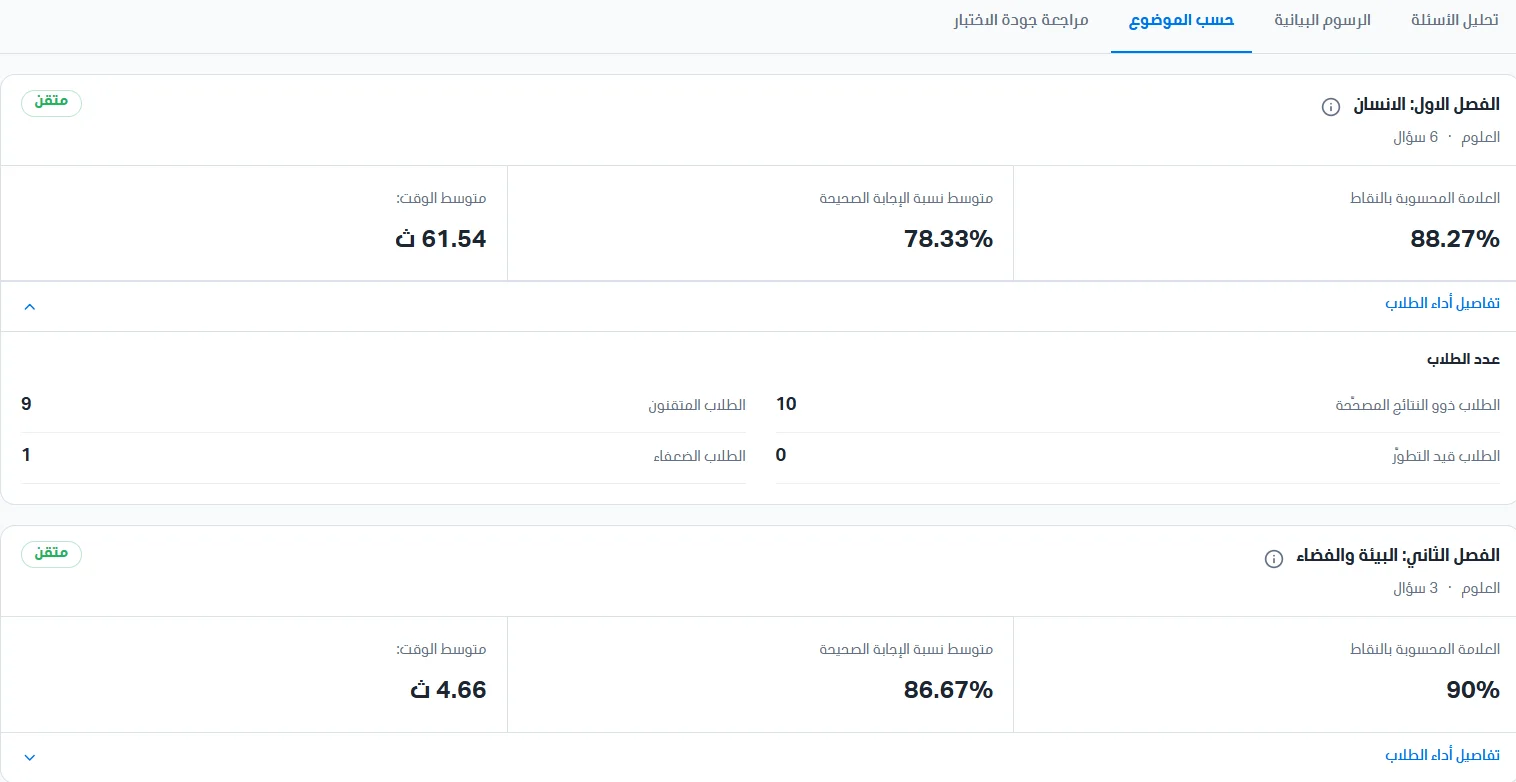
Analysis by topic
This section shows question analysis by topic. Each card shows the following data: the topic name, the bank, and the number of questions from the topic; the marks ratio calculated by points; the average ratio of correct answers; the average time; and student performance details.
Click Student performance details to see: the number of students with graded results, the number of students in progress, the number of proficient students, and the number of weak students.
Test quality review
This page helps you find the questions that deserve review after the exam is graded, based on the graded results. Click Refresh to reload the numbers. Statistics are calculated on approved, fully graded attempts, once per student; retakes are not counted as additional students, and pending results (awaiting grading) are excluded.
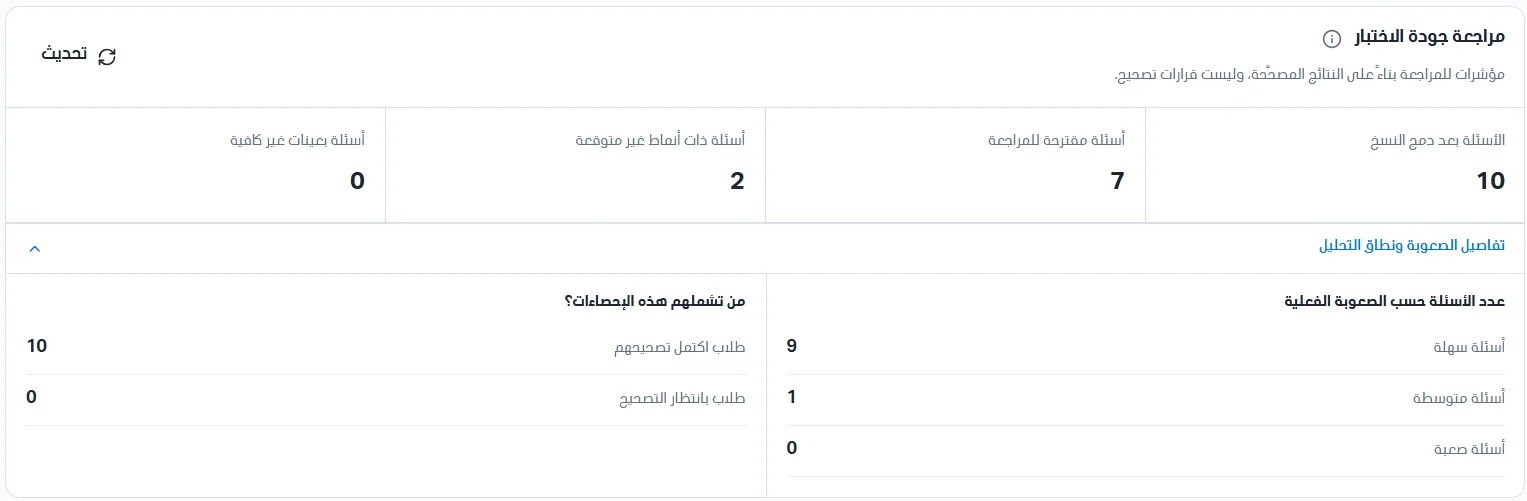
Section 1: four summary cards appear at the top:
Questions after merging versions: the number of questions analyzed after merging exam versions.
Questions suggested for review: the number of questions that have at least one review indicator.
Questions with unexpected patterns: questions in which unexpected answers appeared.
Questions with insufficient samples: questions that not enough students answered, so they were not evaluated.
Click Difficulty and analysis scope details to see the number of questions by actual difficulty (easy, medium, and hard), and who these statistics cover: students whose grading is complete (students whose results entered the analysis) and students awaiting grading (temporarily excluded from the analysis until their grading is complete).
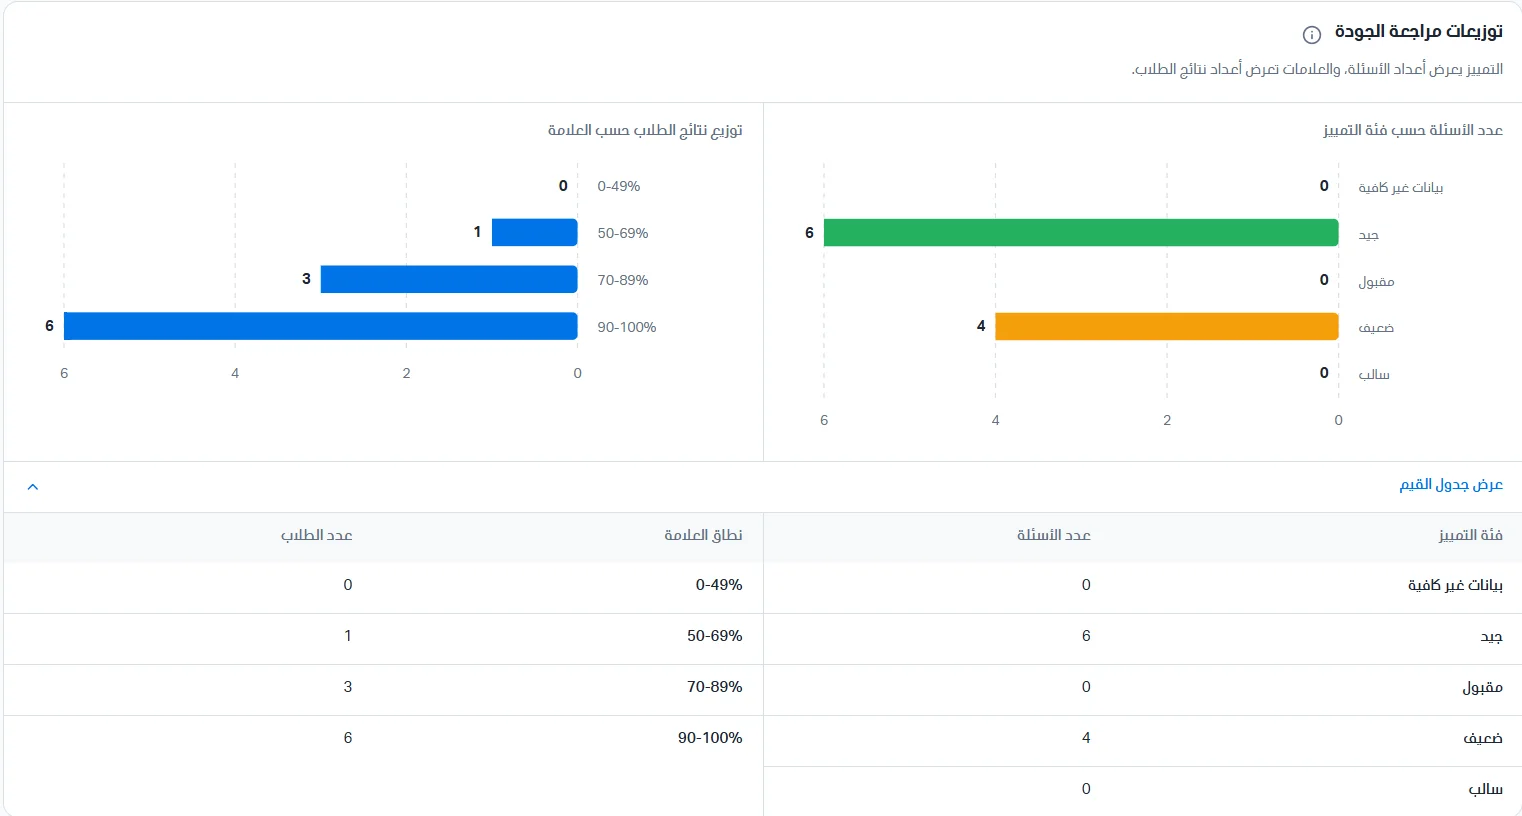
Section 2 (Quality review distributions): shows the number of questions by discrimination category (good, acceptable, weak, negative, insufficient data); the Charts page explains what these categories mean. It also shows the distribution of student results by mark in horizontal bars for the ranges 0-49%, 50-69%, 70-89%, and 90-100%. Click Show values table to see the numbers in a table.
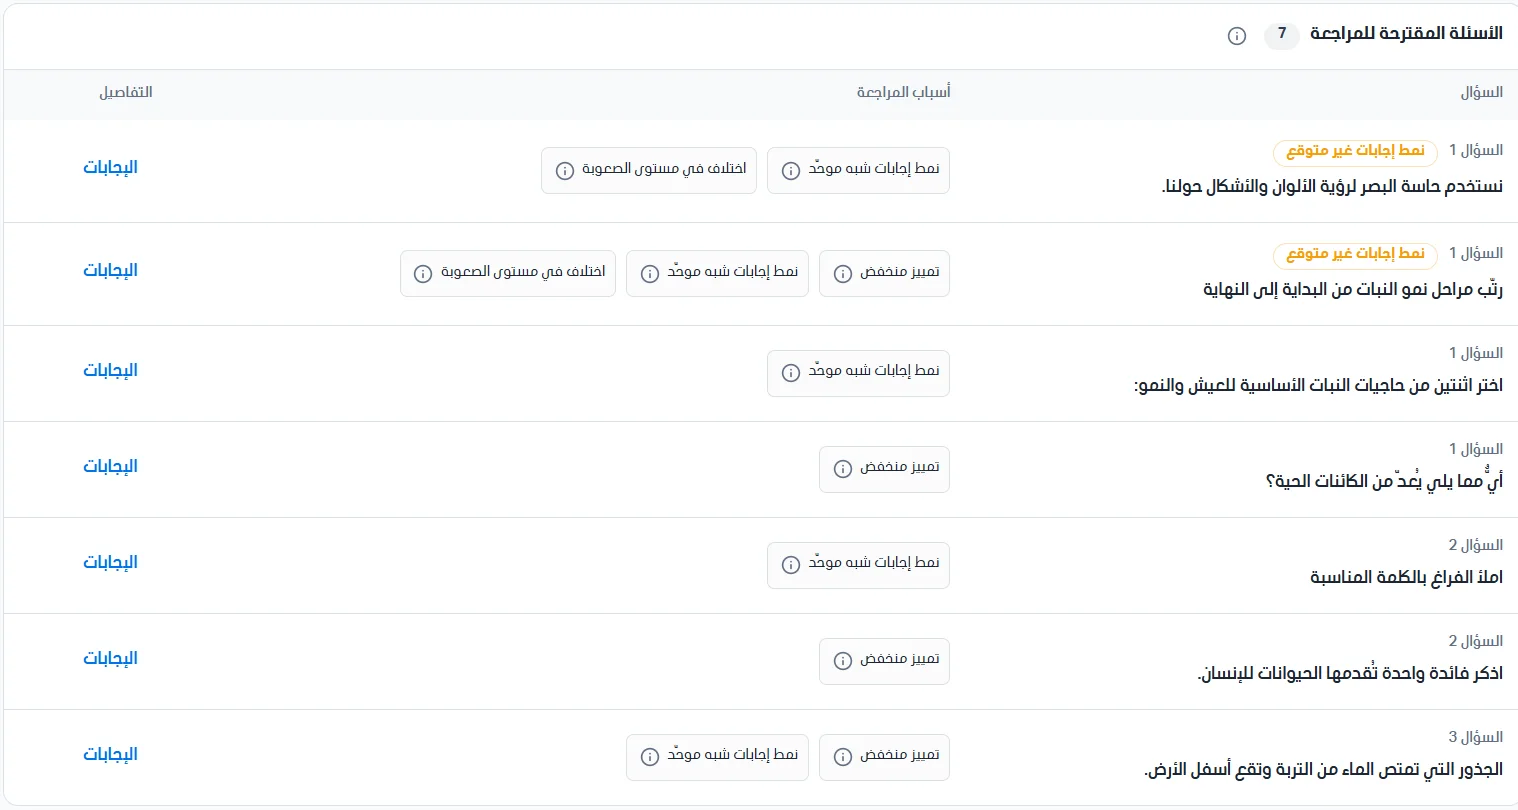
Section 3 (Questions suggested for review): a table of the questions that have a review indicator, showing the question number and text, the reasons for review, and the details. A question may carry more than one indicator. The reasons for review are:
Unexpected answer pattern: an answer pattern that differs from what is expected and deserves a review of the answers.
Near-uniform answer pattern: almost all students gave the same answer.
Difficulty level mismatch: the question's actual difficulty differs from the difficulty set when it was created.
Low discrimination: the question does not separate strong and weak students enough.
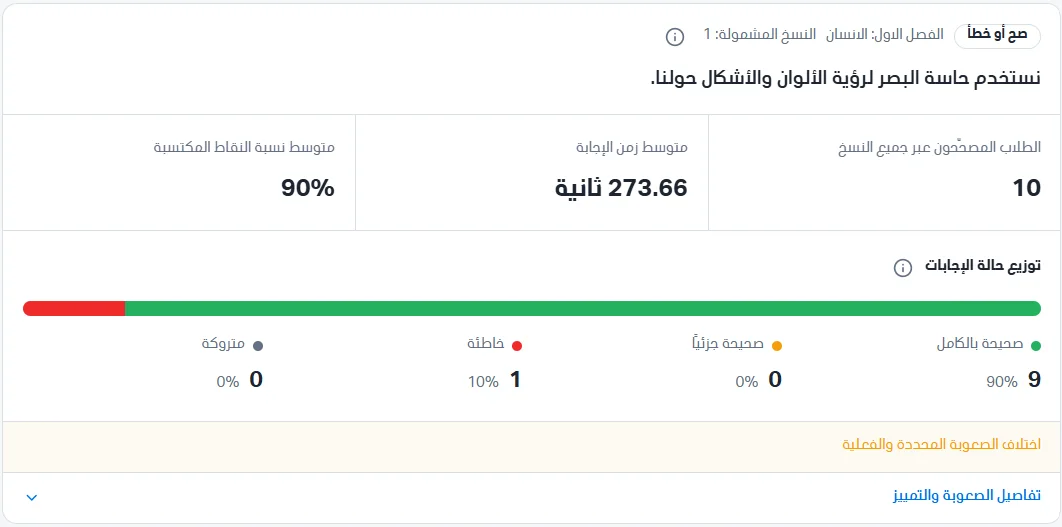
Click Answers to show the answer analysis. The first part shows the question information: the question type (for example, true or false), its topic, the included versions (the number of exam versions in which the question appeared and was analyzed), and its text. Three cards appear: graded students across all versions, average answer time in seconds, and average points earned ratio (which is the actual difficulty).
Answer status distribution: a colored bar showing the distribution of students' answers, with the count and percentage of each status beneath it: fully correct (green: the student got full points), partially correct (orange: the student got part of the points), wrong (red: no points), and left blank (gray: the student did not answer the question). Example: 9 students (90%) answered fully correct, 1 student (10%) got it wrong, and there are no partial or left-blank answers.
In Difficulty and discrimination details you will find the actual difficulty compared with the set difficulty (the level the question's author chose, easy, medium, or hard, versus the level calculated from student performance), and the discrimination data: the discrimination category (good, acceptable, weak, negative, or insufficient data), the sample (the number of graded students included in the calculation, at least 10 required), the discrimination coefficient (a number measuring the question's ability to tell strong students from weak ones), and the upper-group average points and lower-group average points (the points ratio of the highest-performing and lowest-performing students in the exam on this question; the latter appears at the bottom of the section when you scroll). Example: discrimination category good, sample 10 students, discrimination coefficient 0.33, and upper-group average points 100%.

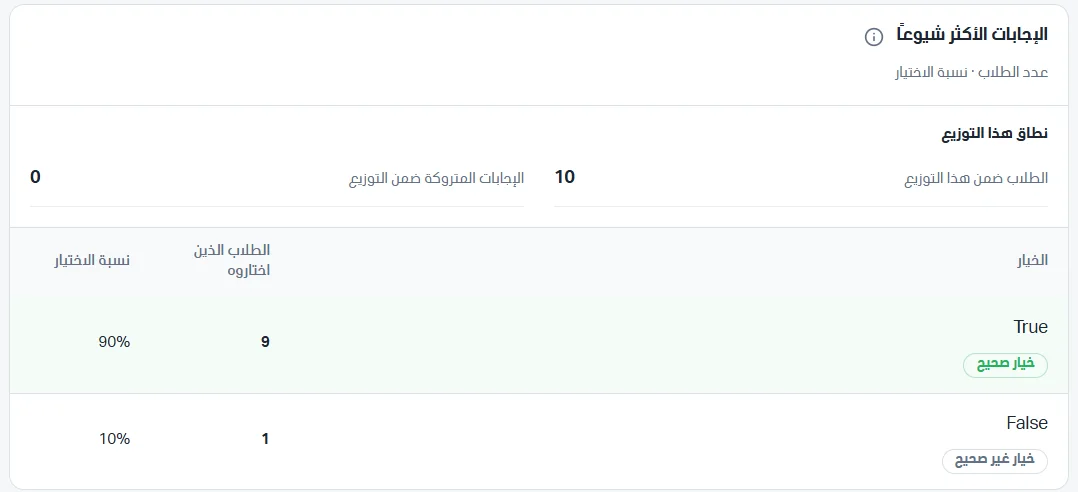
The Most common answers section shows the options students chose and how many chose each: students in this distribution, left-blank answers within the distribution, and a table with the option (the option text with a correct or incorrect label), the students who chose it, and the selection rate out of the total students.